
In this article we look at the Exposure histogram, providing a guide to what it is for, and how it works
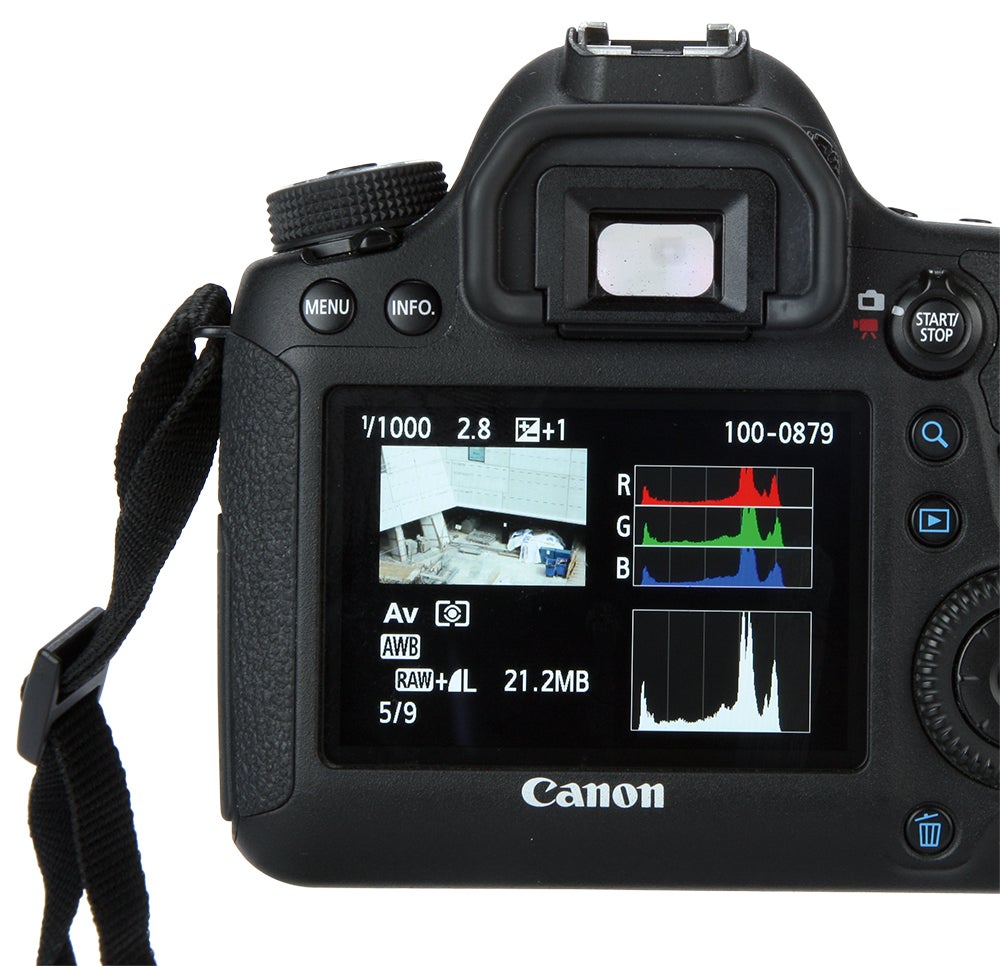
Some cameras show separate RGB histograms
An exposure histogram is one of the most useful tools a photographer has and it can be just as effective setting up a scene as post-processing an image. A vague recollection from school maths may paint a picture of a bar chart and boring statistics, but for photographers a histogram is far from mundane. At a glance, an exposure histogram shows you the balance of the scene’s brightness and when the picture might have overly dark or overly bright or burned-out areas. Yes, a histogram is a graph.
The x axis from left to right starts at complete darkness and finishes at a total white-out. The vertical y axis refers to the amount of the brightness corresponding to the position along the x axis, usually between 0 and 255. The brightness of every pixel in the image is logged and plotted, building up piles of pixels of matching brightness. Once all the pixels have been sorted into one of the 255 brightness values and plotted, you have an exposure histogram.
How to read a histogram
If the graph is lopsided to the left you have a darker image, while if it is to the right you have a brighter one. If the histogram is chopped off at either end it could indicate that the exposure is too high or too low. If the plot is low and widely spread you may have an image lacking in contrast. If the graph doesn’t fall near either end of the scale you may have an image lacking in smooth tonal gradation. For a general scene with lots of contrast and tones, you could be rewarded with a classic histogram with a gentle peak in the centre and extending to both ends of the scale.
Many modern cameras have a live histogram mode to help you adjust exposure manually, or bias the auto exposure in one direction or the other. If the camera doesn’t offer a live histogram mode, at the very least it should offer a histogram display option when reviewing images just taken.
In post-processing software, a histogram view is an essential aid to adjusting the brightness and contrast of an image. More advanced use of the exposure histogram can be made by evaluating individual colour channels and making appropriate adjustments to colour balance.